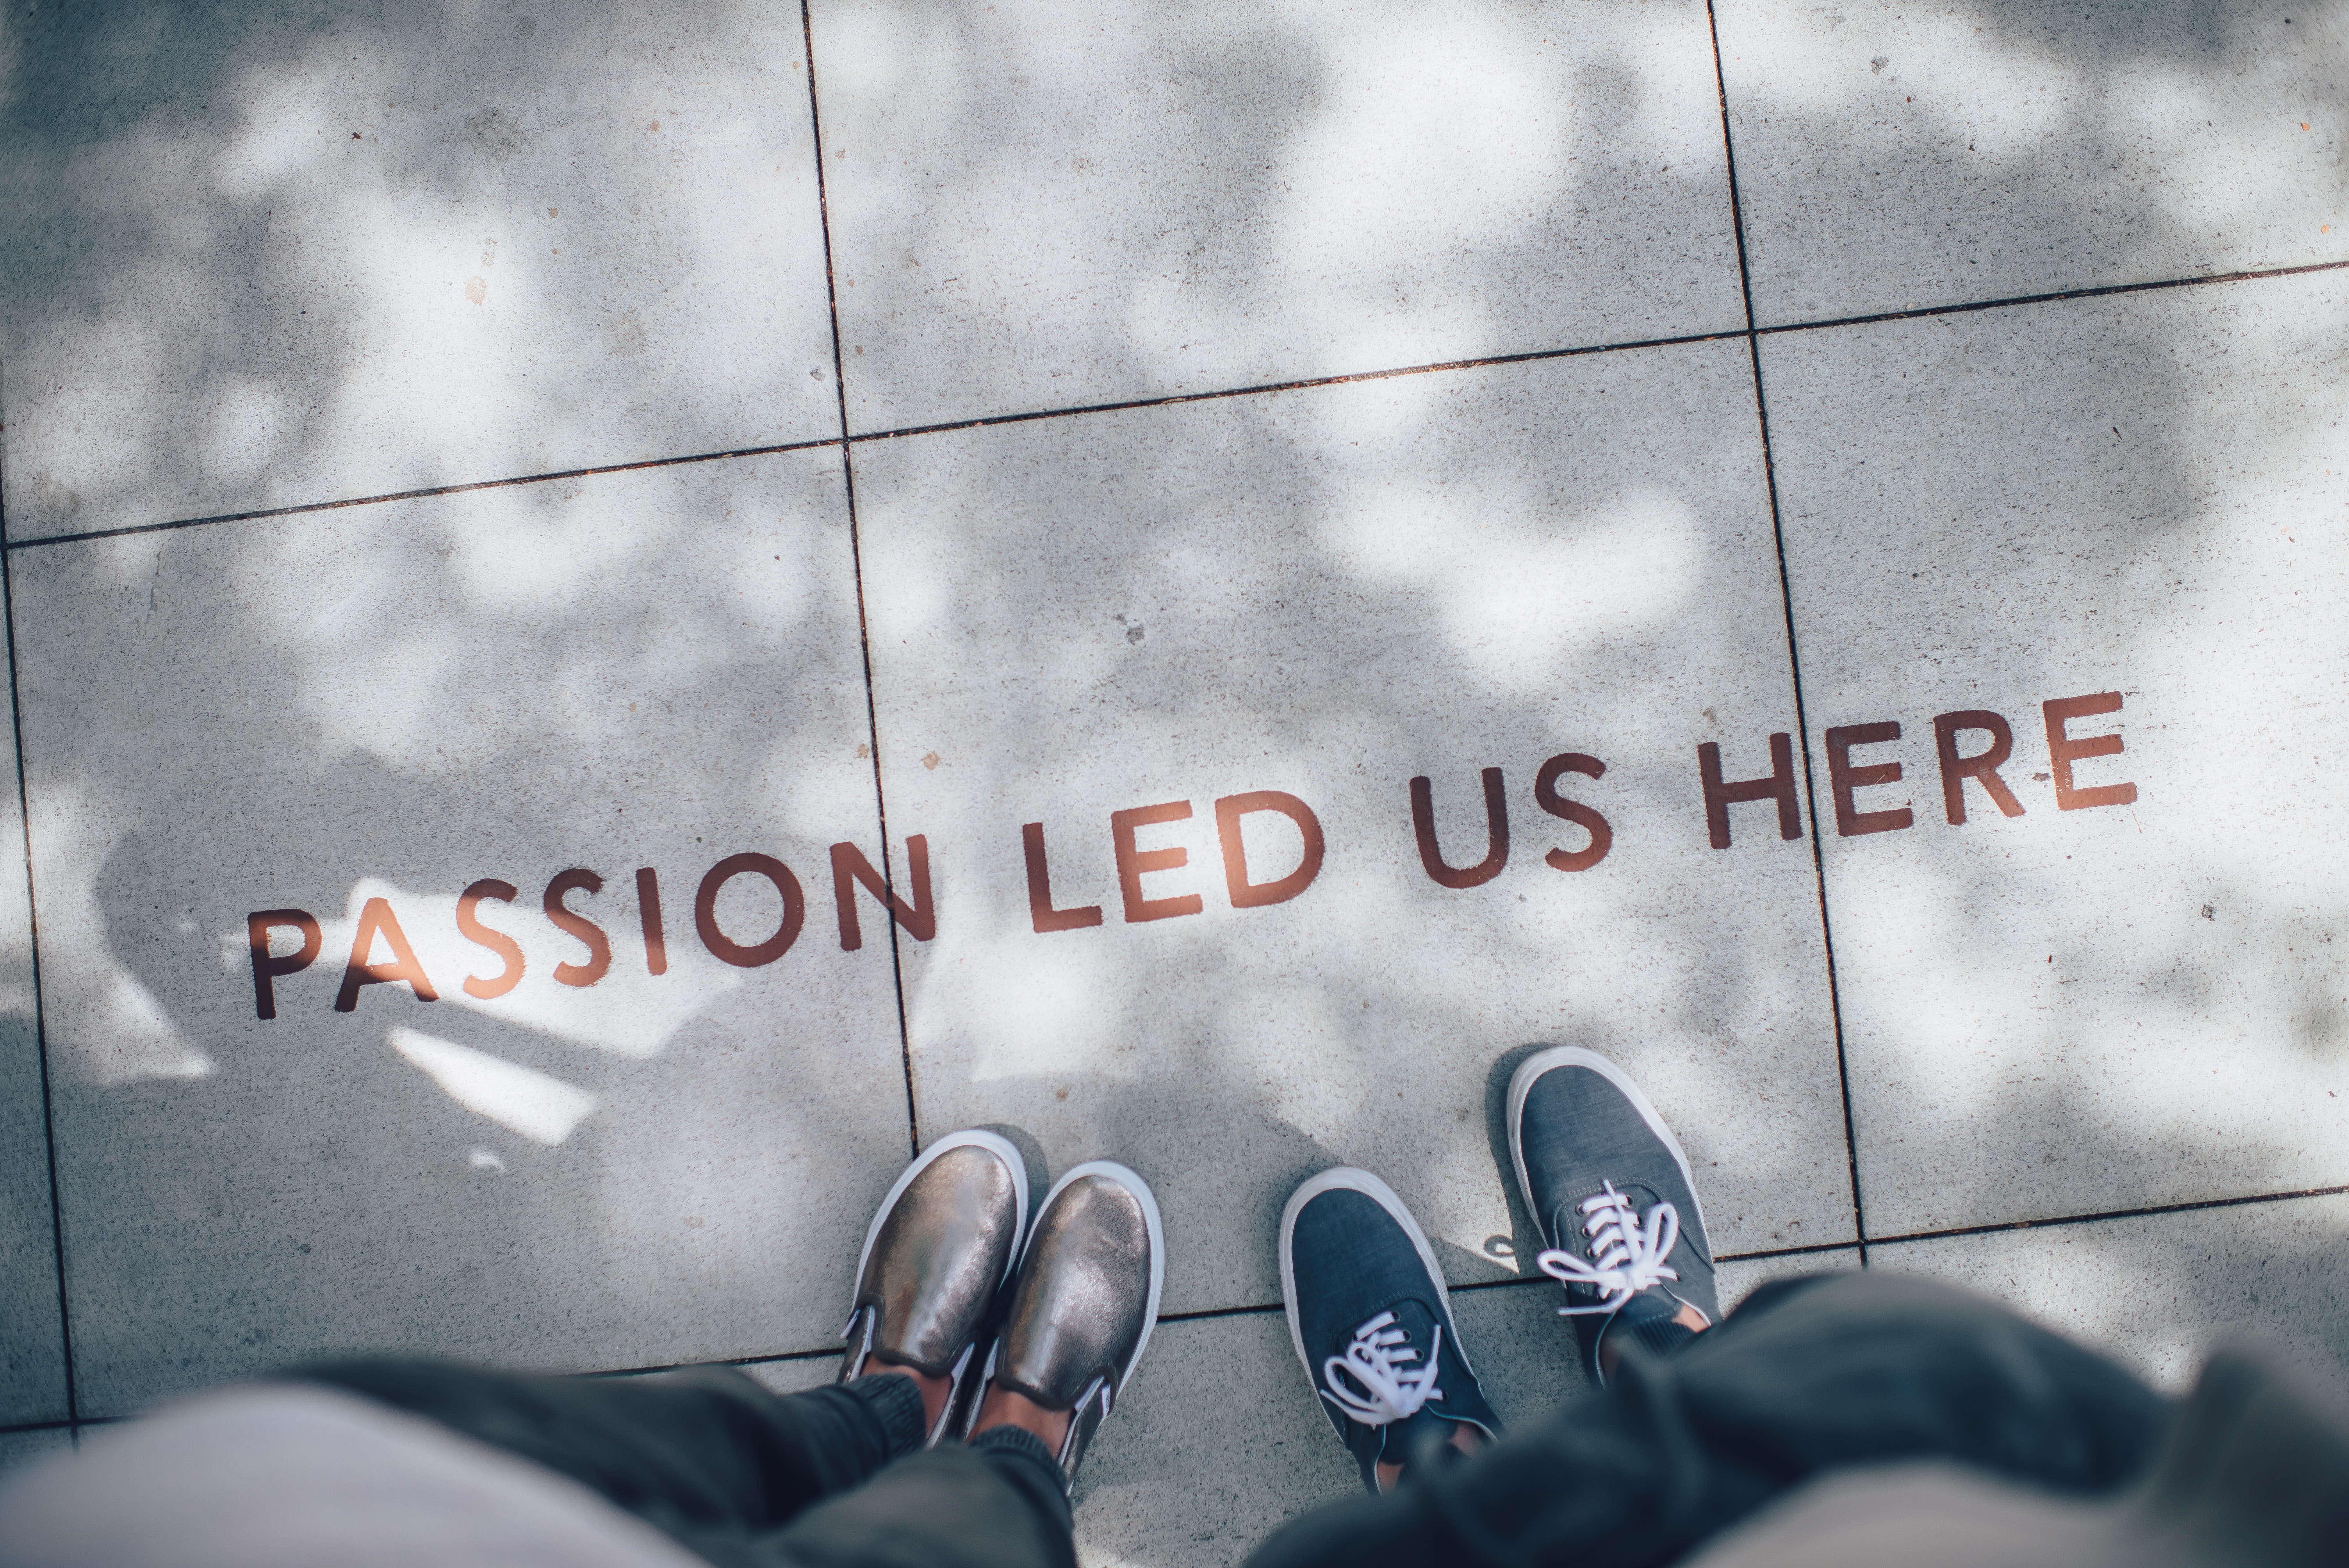
I am a data scientist with a passion for storytelling. I believe that words and data are the two most powerful tools to change the world.
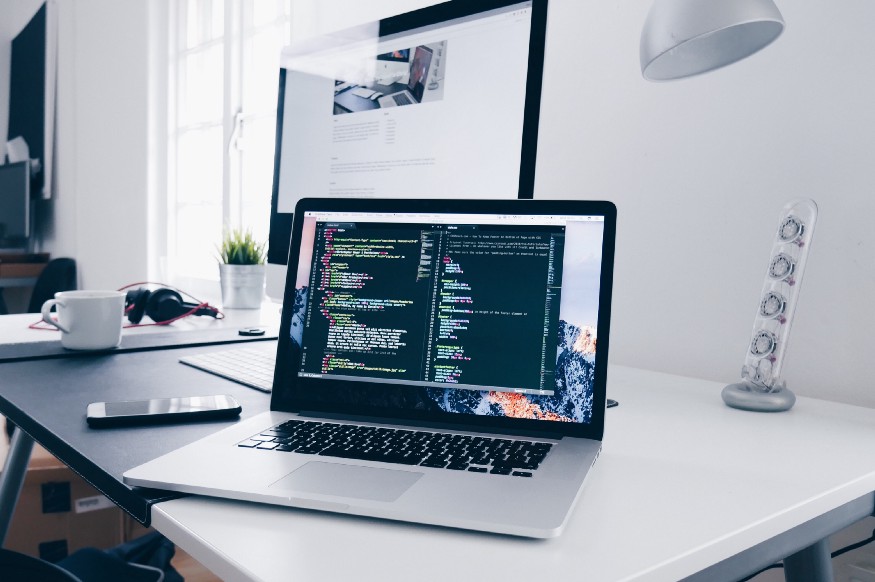
Most of my time is spent staring at a computer screen. During the day, I am usually programming, working to derive insight from large datasets. My skills include data analysis, visualization, and machine learning.
I have developed a strong acumen for problem solving, and I enjoy an occasional challenge.
I often work on end-to-end data science projects that usually begin from collecting data from third party sources and end with delivering business insight in the form of customer segments.
At night, I take some time off to work on things I'm passionate about. I write articles and publish them on the Internet.
Sometimes, I create personal projects and write tutorials on them. I also enjoy going on sites like HackerRank and
trying out their programming challenges.
You can take a look at some of my projects and articles in the section below. I will link my work to their GitHub repositories, so feel free to download my code and play around with it.
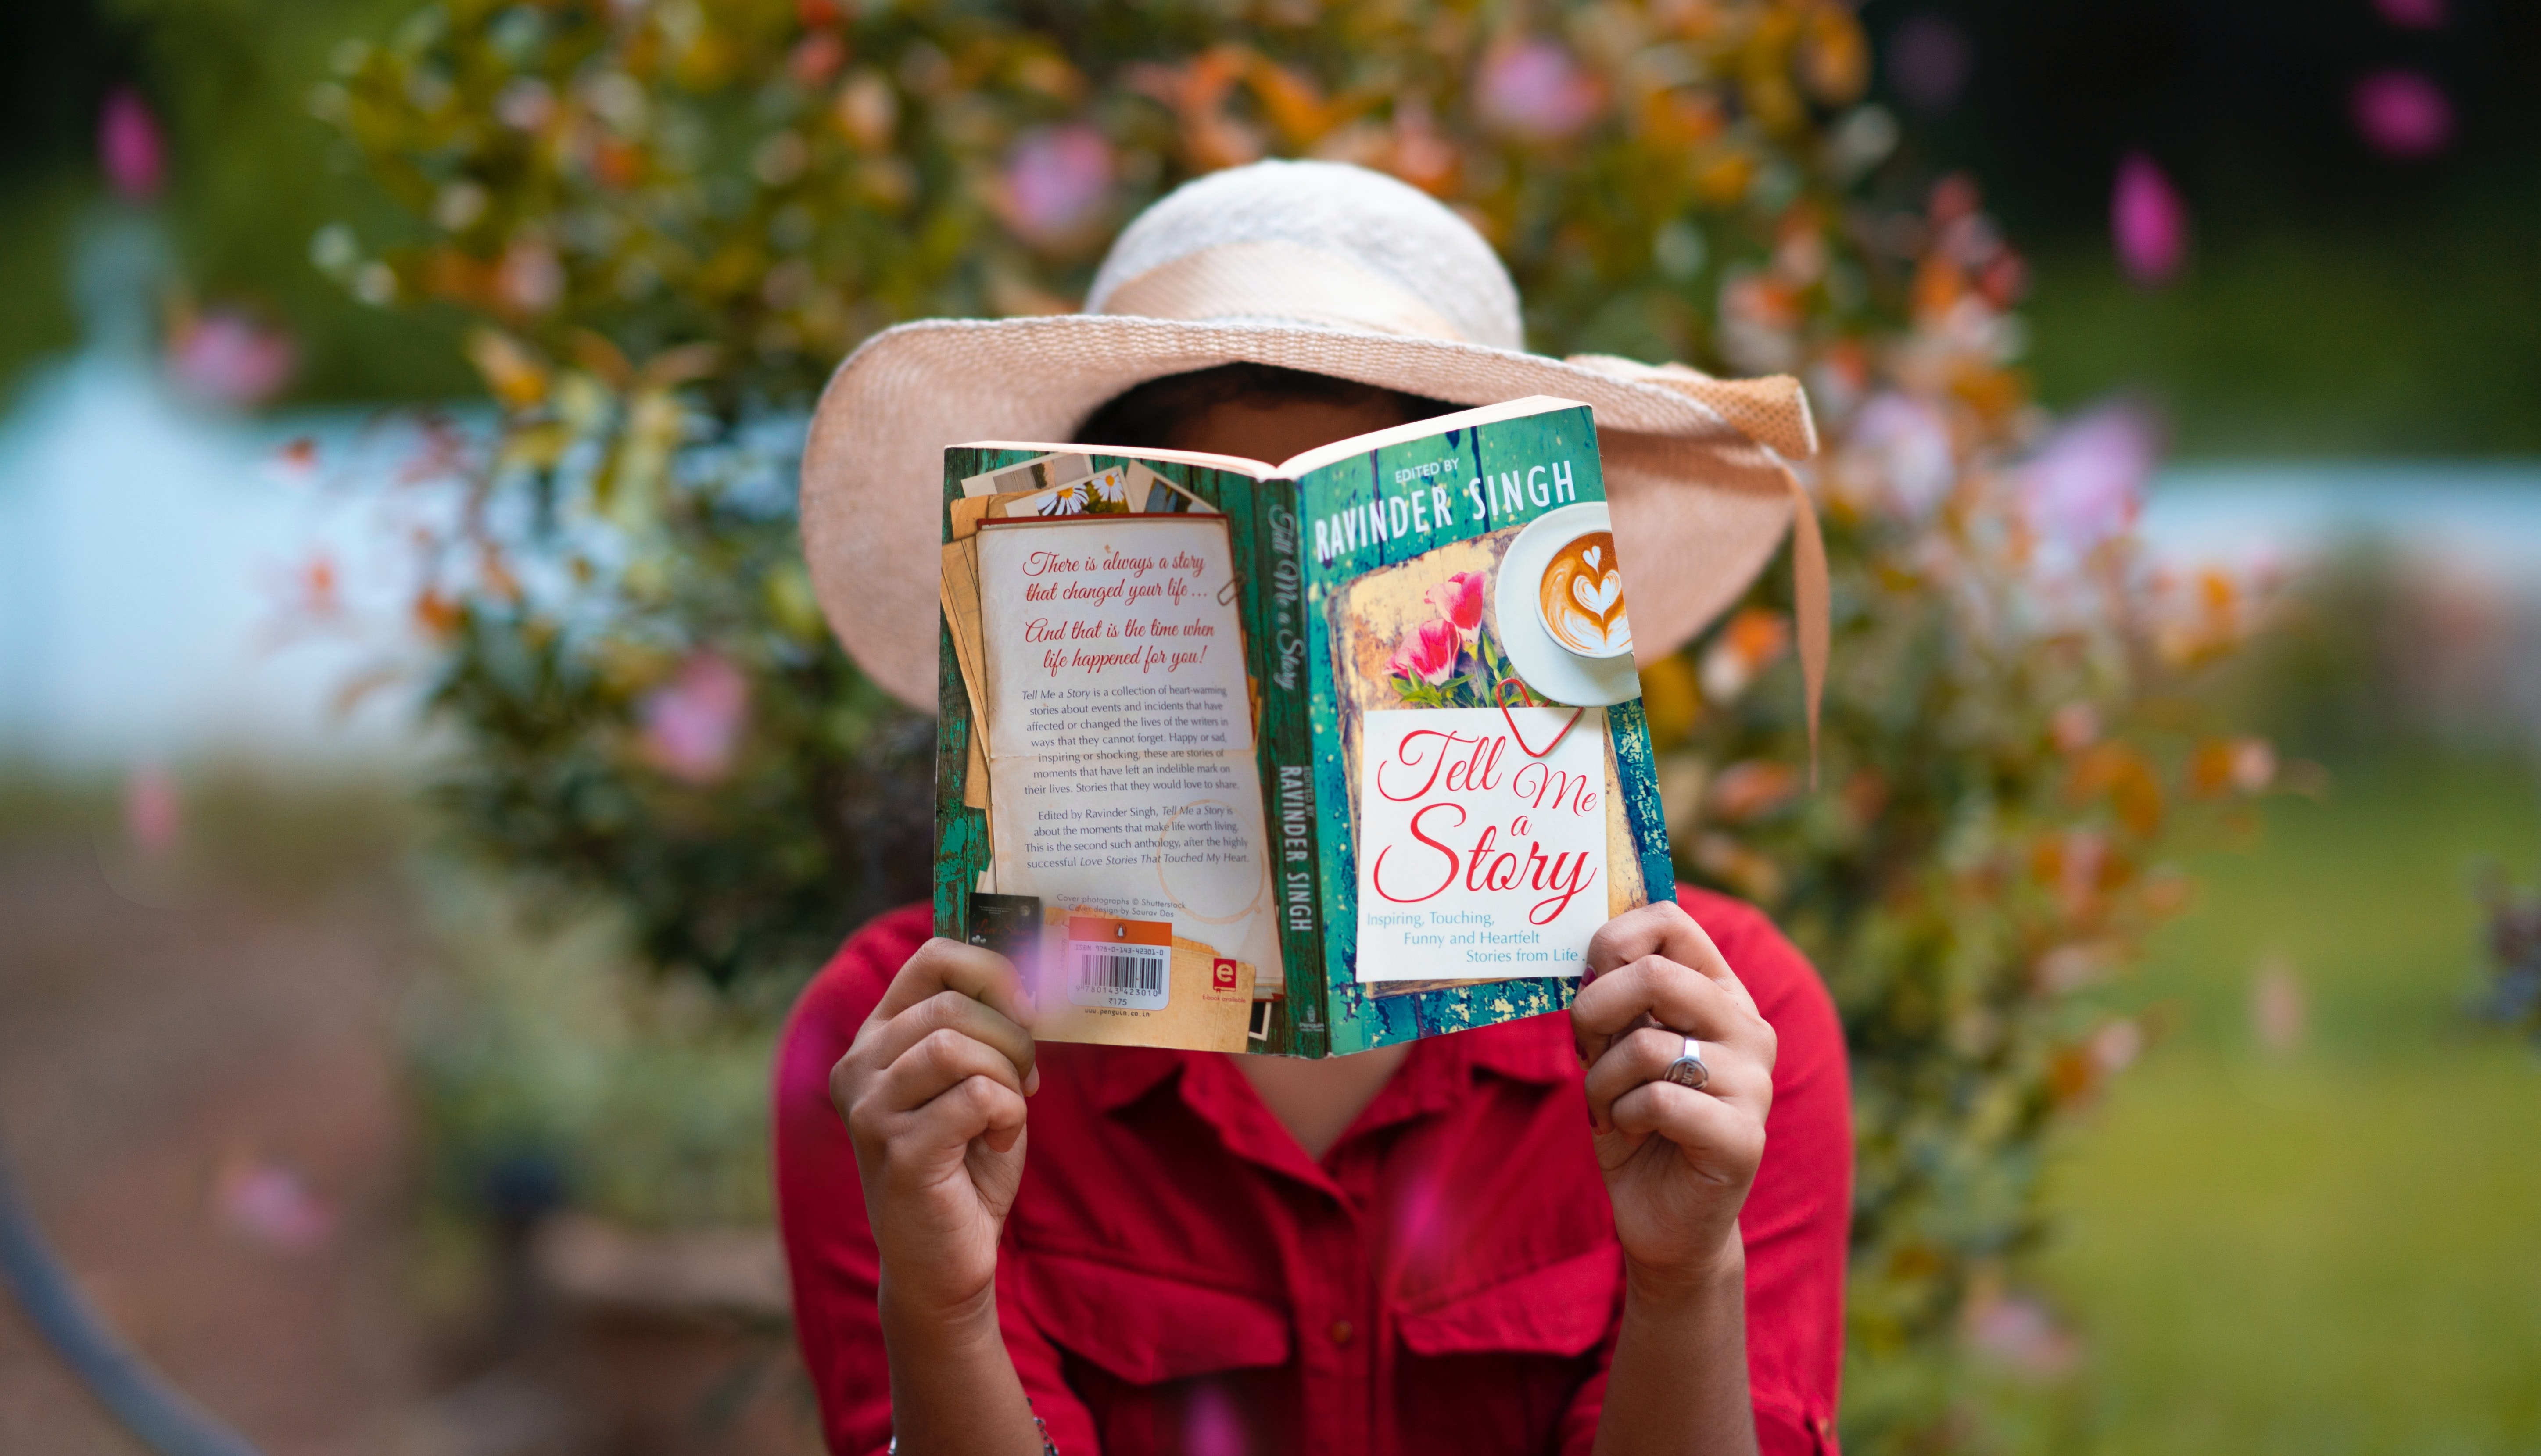
Most of my education has come from online platforms.
I have downloaded e-books, audited courses on edX and Coursera, and spent countless hours on sites like HackerRank and FreeCodeCamp. I am grateful to online educators who have given me the opportunity to learn these things, and for democratizing education.
To give back to the community, I create tutorials detailing things I have learnt.
I create starter code for data science and visualization projects and publish it for everyone to read.
If you are a data science aspirant, please feel free to check out these tutorials on my blog site.
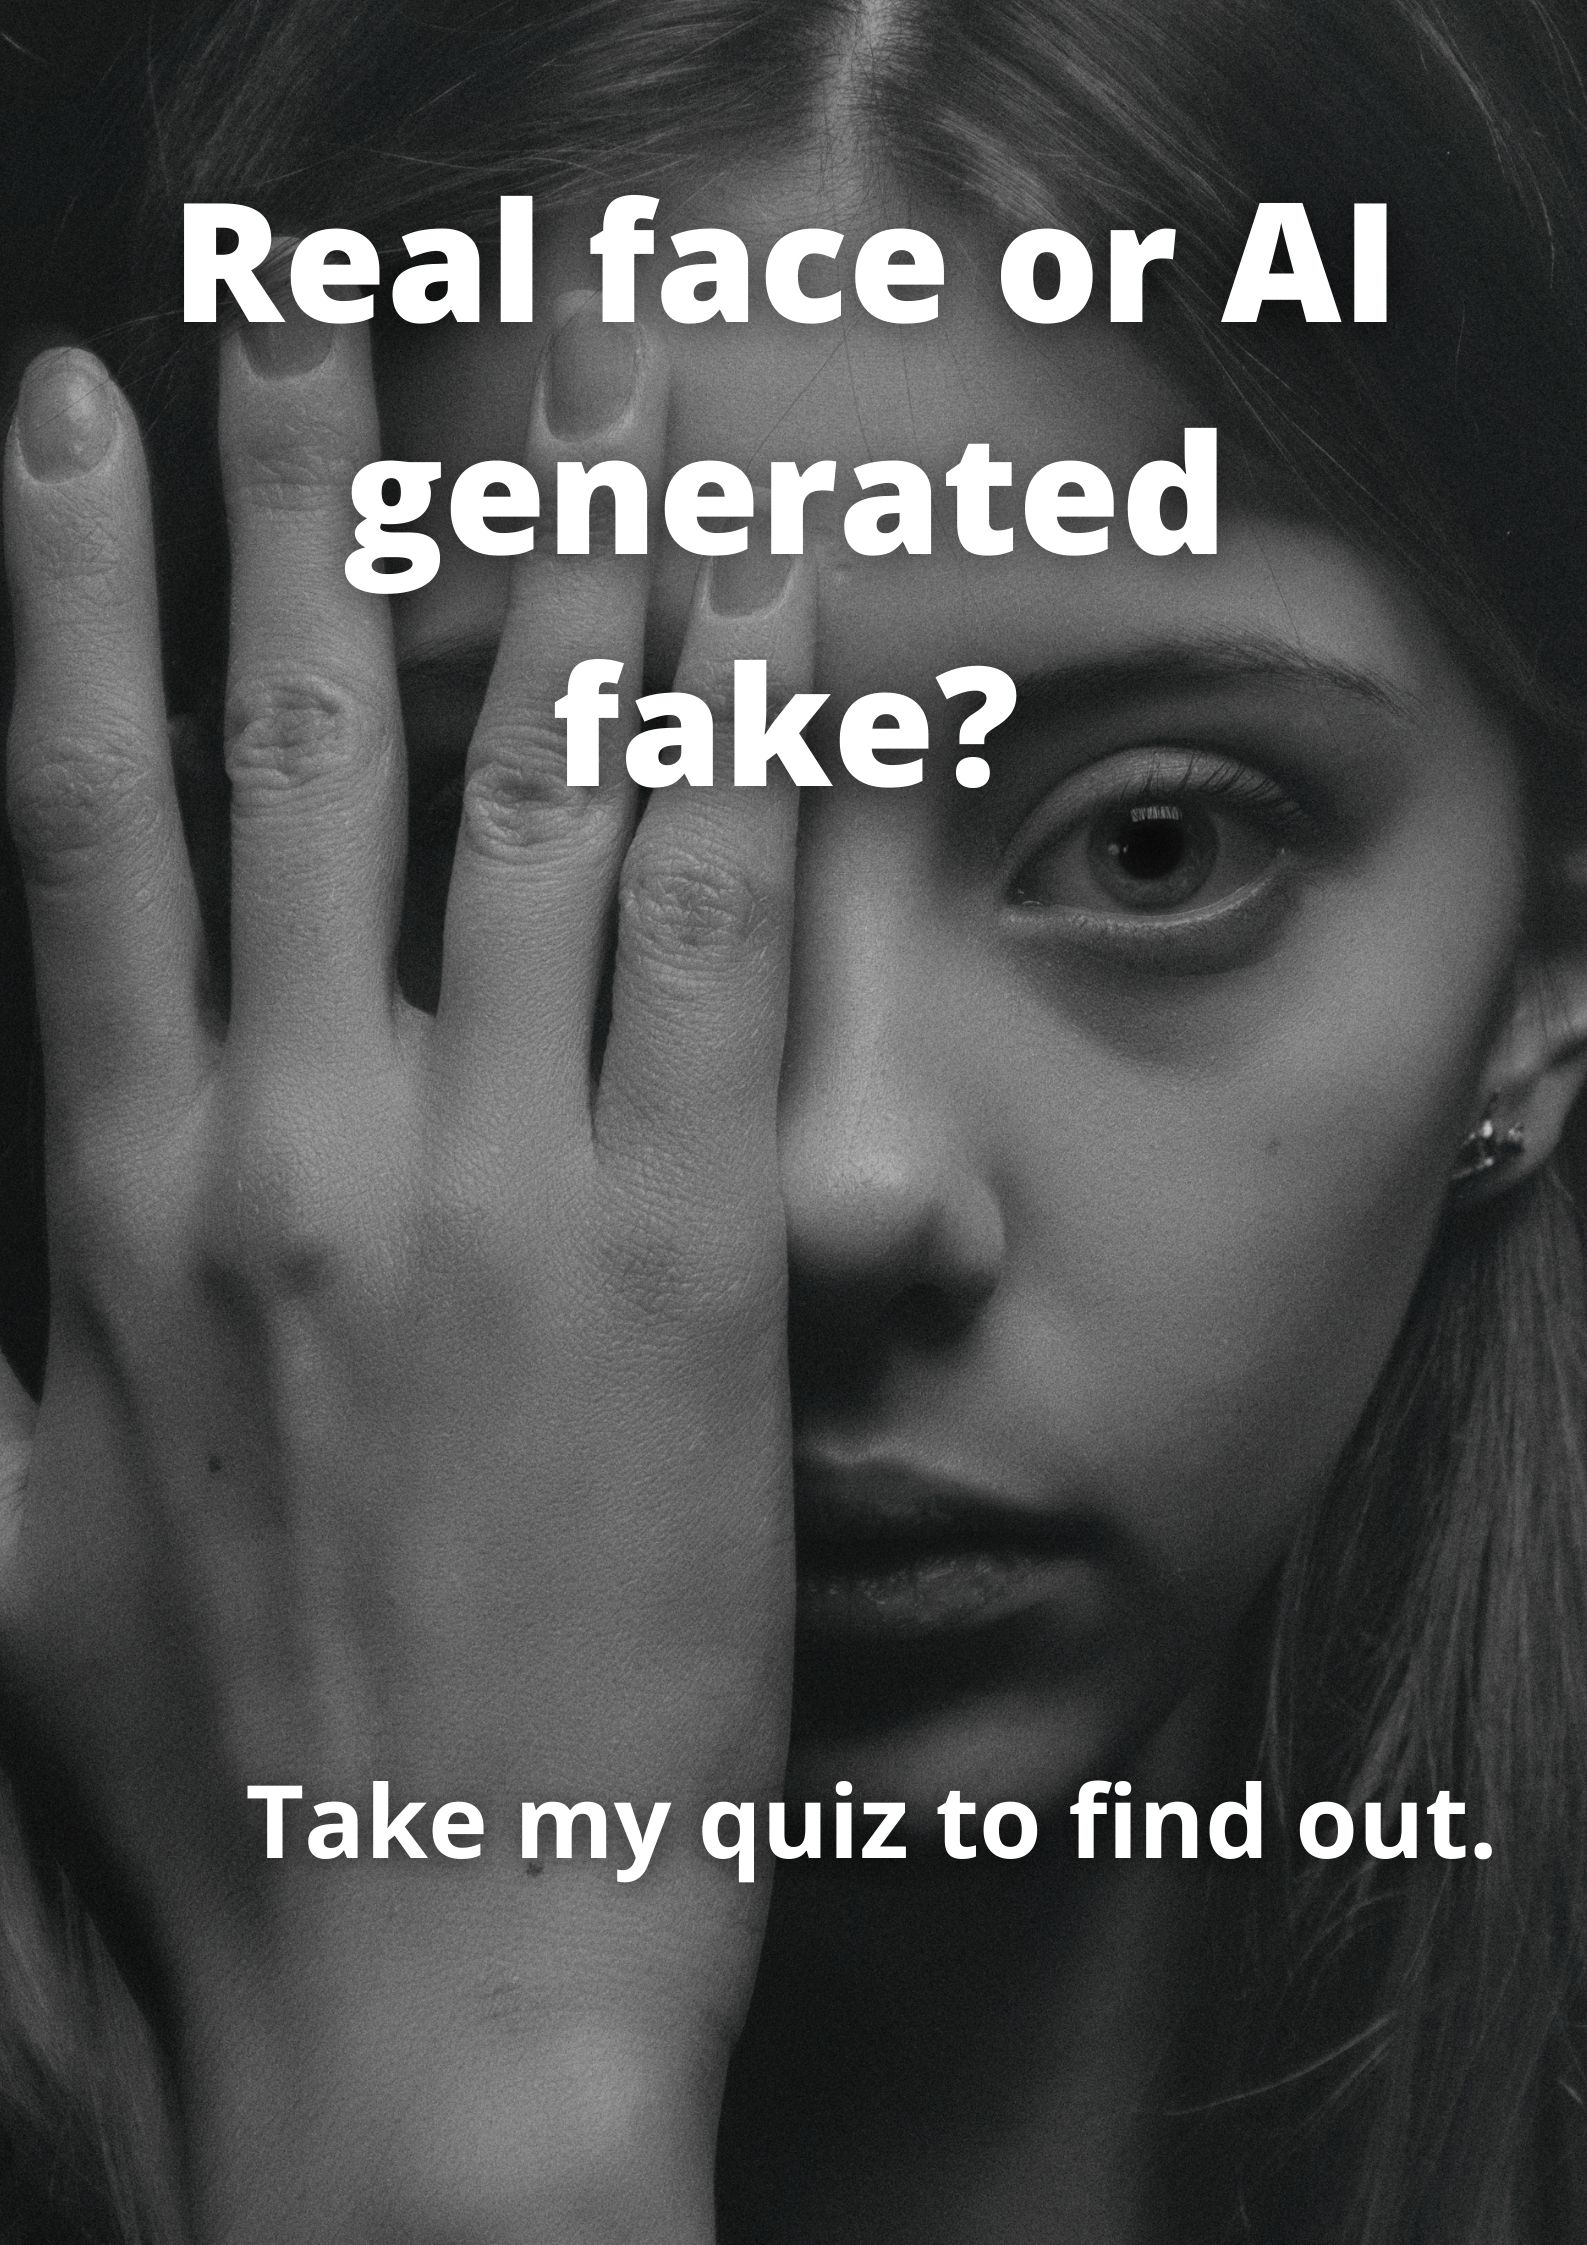
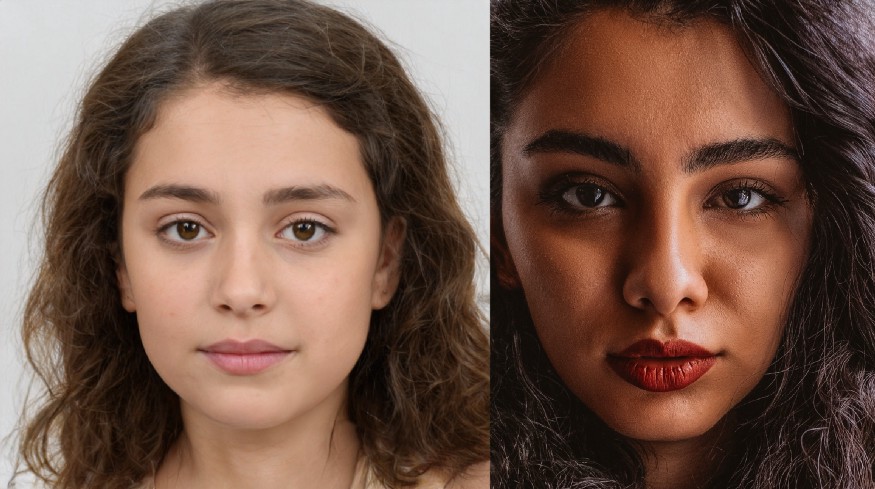
If presented with two images, would you be able to tell the difference between the real face and the AI fake?
In this project, I created an app that tests you on your ability to distinguish fake faces from real ones.
All you need to do is take my quiz and select whether you think the person in the picture is real.
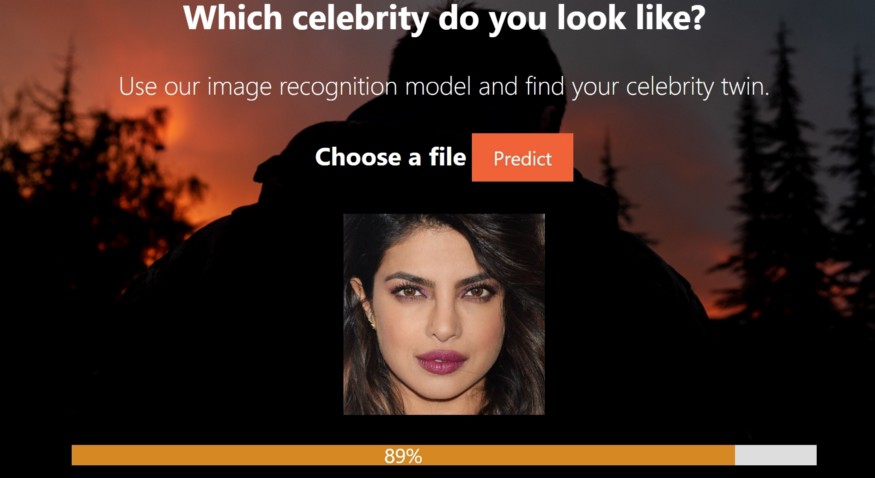
Have you every wondered who your celebrity lookalike was? You can find out with my facial recognition app!
All you need to do is select a picture of yourself and upload it, then click on predict. Just wait for a few seconds, and you will get your result.
In this project, I collected data from multiple different sources to analyze gender disparity in Hollywood. The project was based on the Bechdel Test, a measure of female representation in Hollywood.
Skills demonstrated: Python, EDA, data collection, data wrangling, data visualization
Publication: Towards Data Science

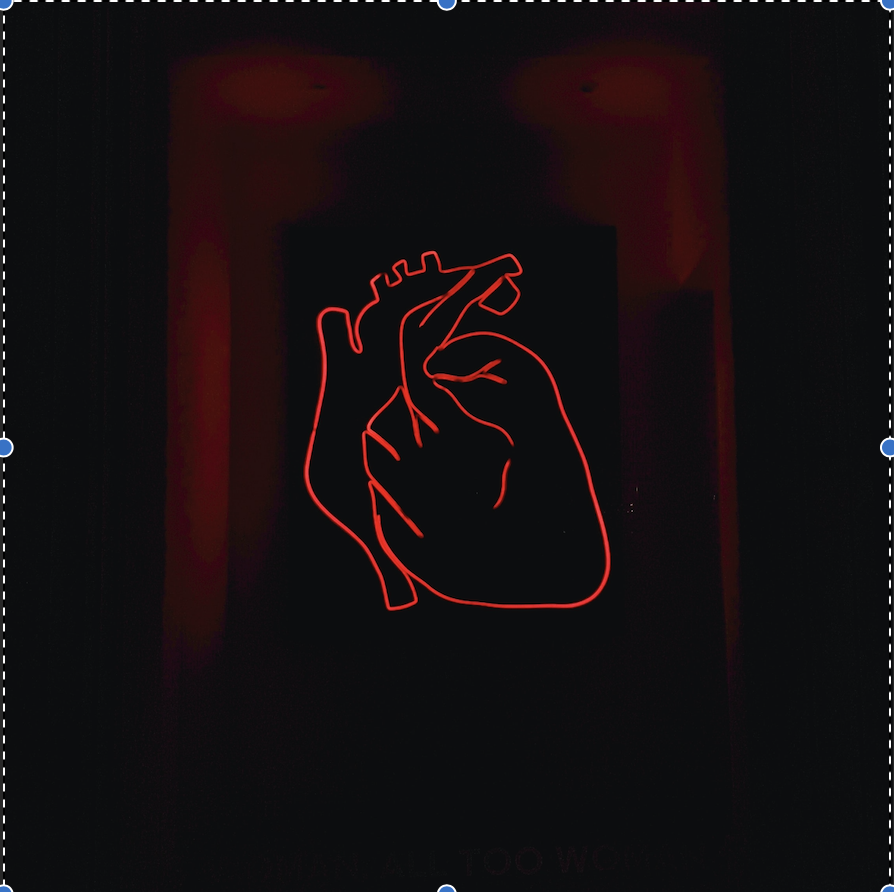
In this project, I analyzed data that was used in the Framingham Heart Study, and visualized the risk factors of heart disease. Then, I built a machine learning pipeline with decision trees to predict the ten year risk
of Coronary Heart Disease.
Skills demonstrated: Python, ML algorithms, EDA, data visualization
Publication: The Startup
In this project, I used a dataset from Kaggle's data science in survey to visualize female representation in the tech sector.
Skills demonstrated: Python, EDA, data visualization
Publication: Better Programming

In this project, I built a web scraper in Python to collect data from an online course review site.
I then conducted some EDA on this data to find some of the best data science courses based on user reviews.
Skills demonstrated: Web Scraping, Python, EDA, data visualization
Publication: Data Driven Investor
In this project, I created a Fastai model for text classification using an MBTI personality prediction dataset.
I used these predictions to create a Harry Potter character classification model. Finally, I created a front-end interface for the model using Dash.
(Note: The Dash app might take a while to load because it was deployed directly from a remote server.)
Skills demonstrated: Python, Dash, deep learning
Publication: Towards Data Science

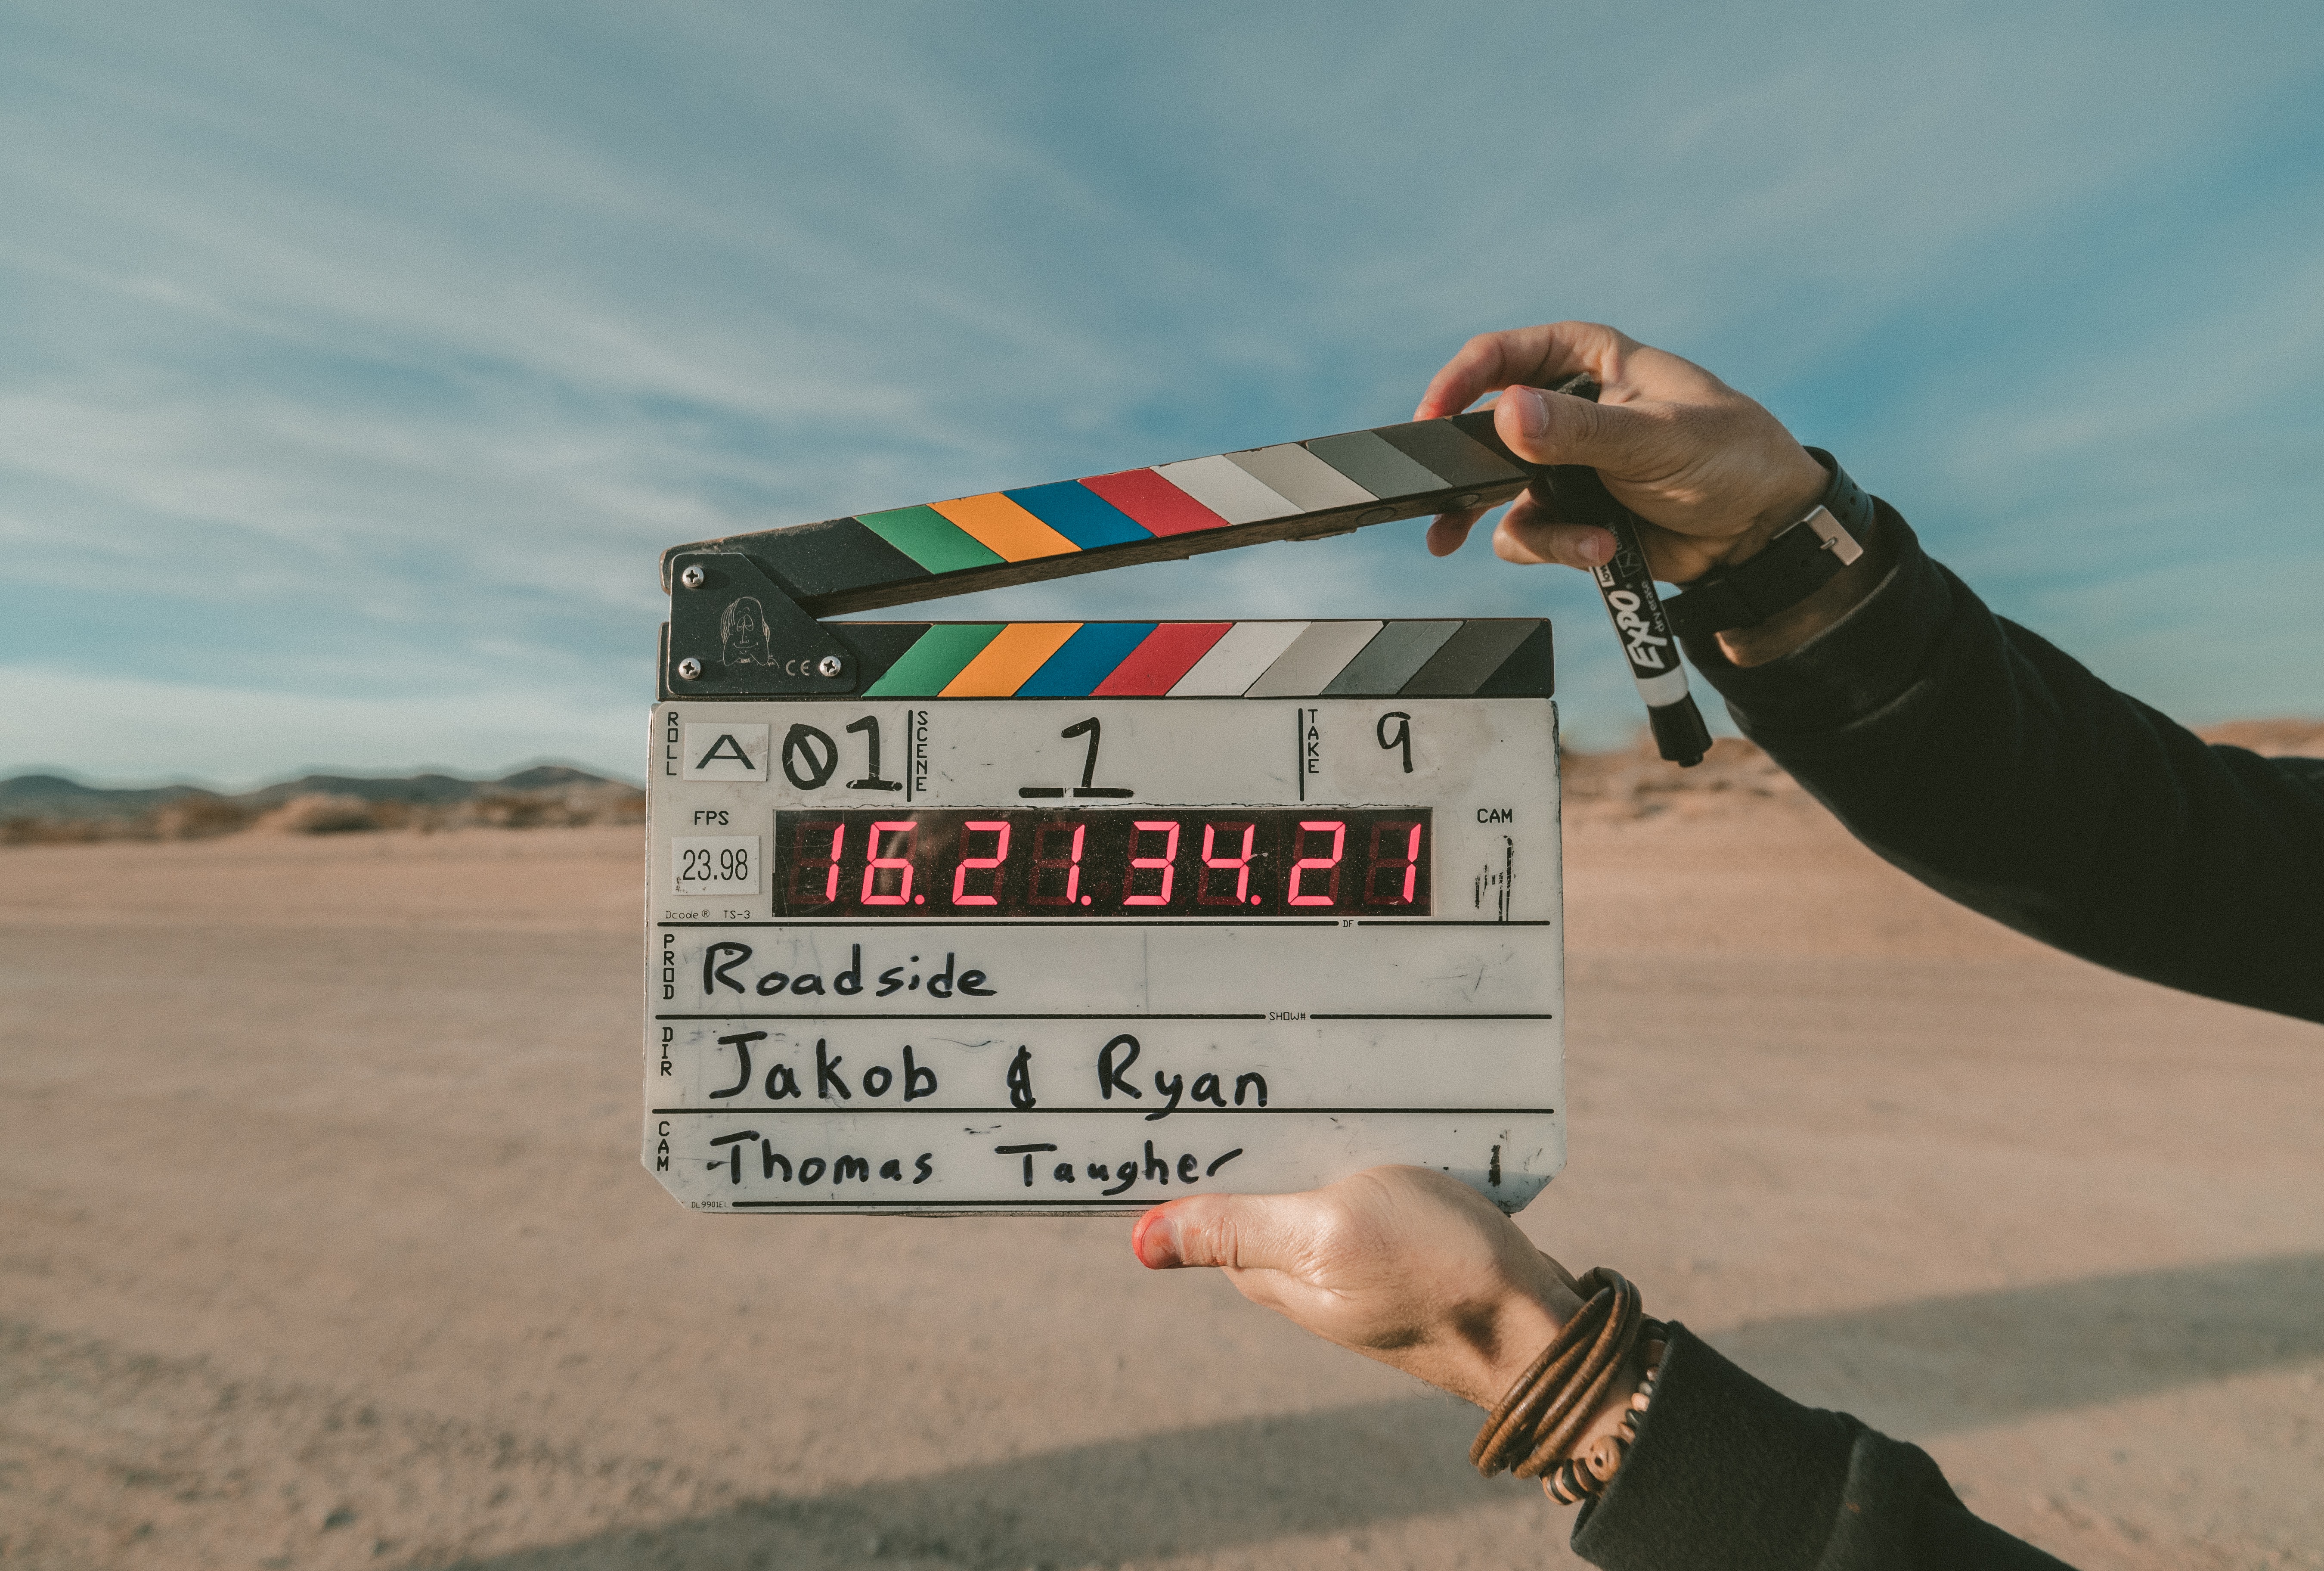
In this project, I built a movie recommender system that takes in user input and comes up with movie suggestions for you to watch.
I also created a movie dashboard using data from multiple sources, and you can find movie information such as reviews and release year.
Finally, I created a web-page with the project description, dashboard, and recommender system.
Skills demonstrated: Front-end design, Python, data collection, machine learning, data analysis, data visualization
Publication: Towards Data Science
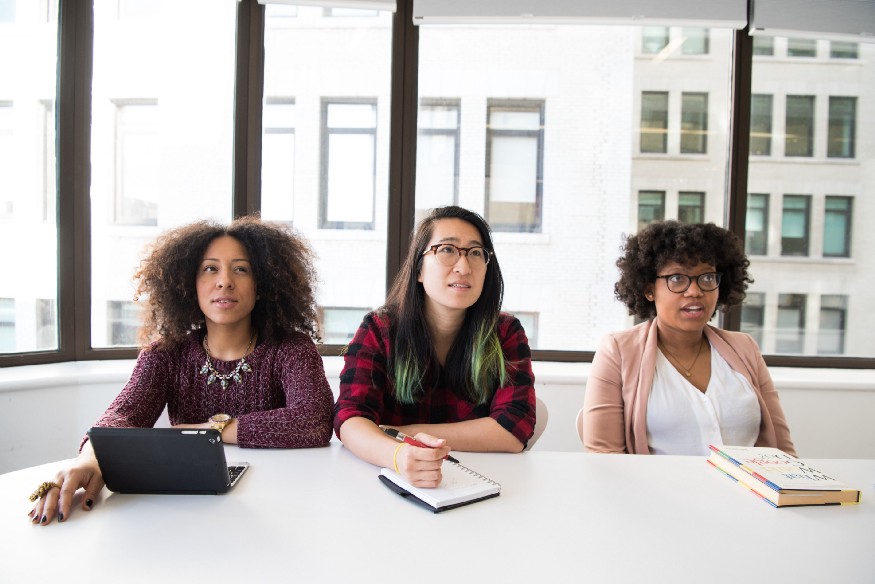
In this article, I write about the lack of female representation in technology. In my opinion, girls aren’t
naturally less inclined to pursue careers in STEM. Rather, they have been conditioned from a young age to stay away from
the field.
I provide insight on the measures that we as a community can take
to ensure that more women develop an interest in tech-related fields.
Publication: Towards Data Science
Most applications of data science today revolve around maximizing profit for large companies.
However, data science can be used for so much more than just increasing revenue.
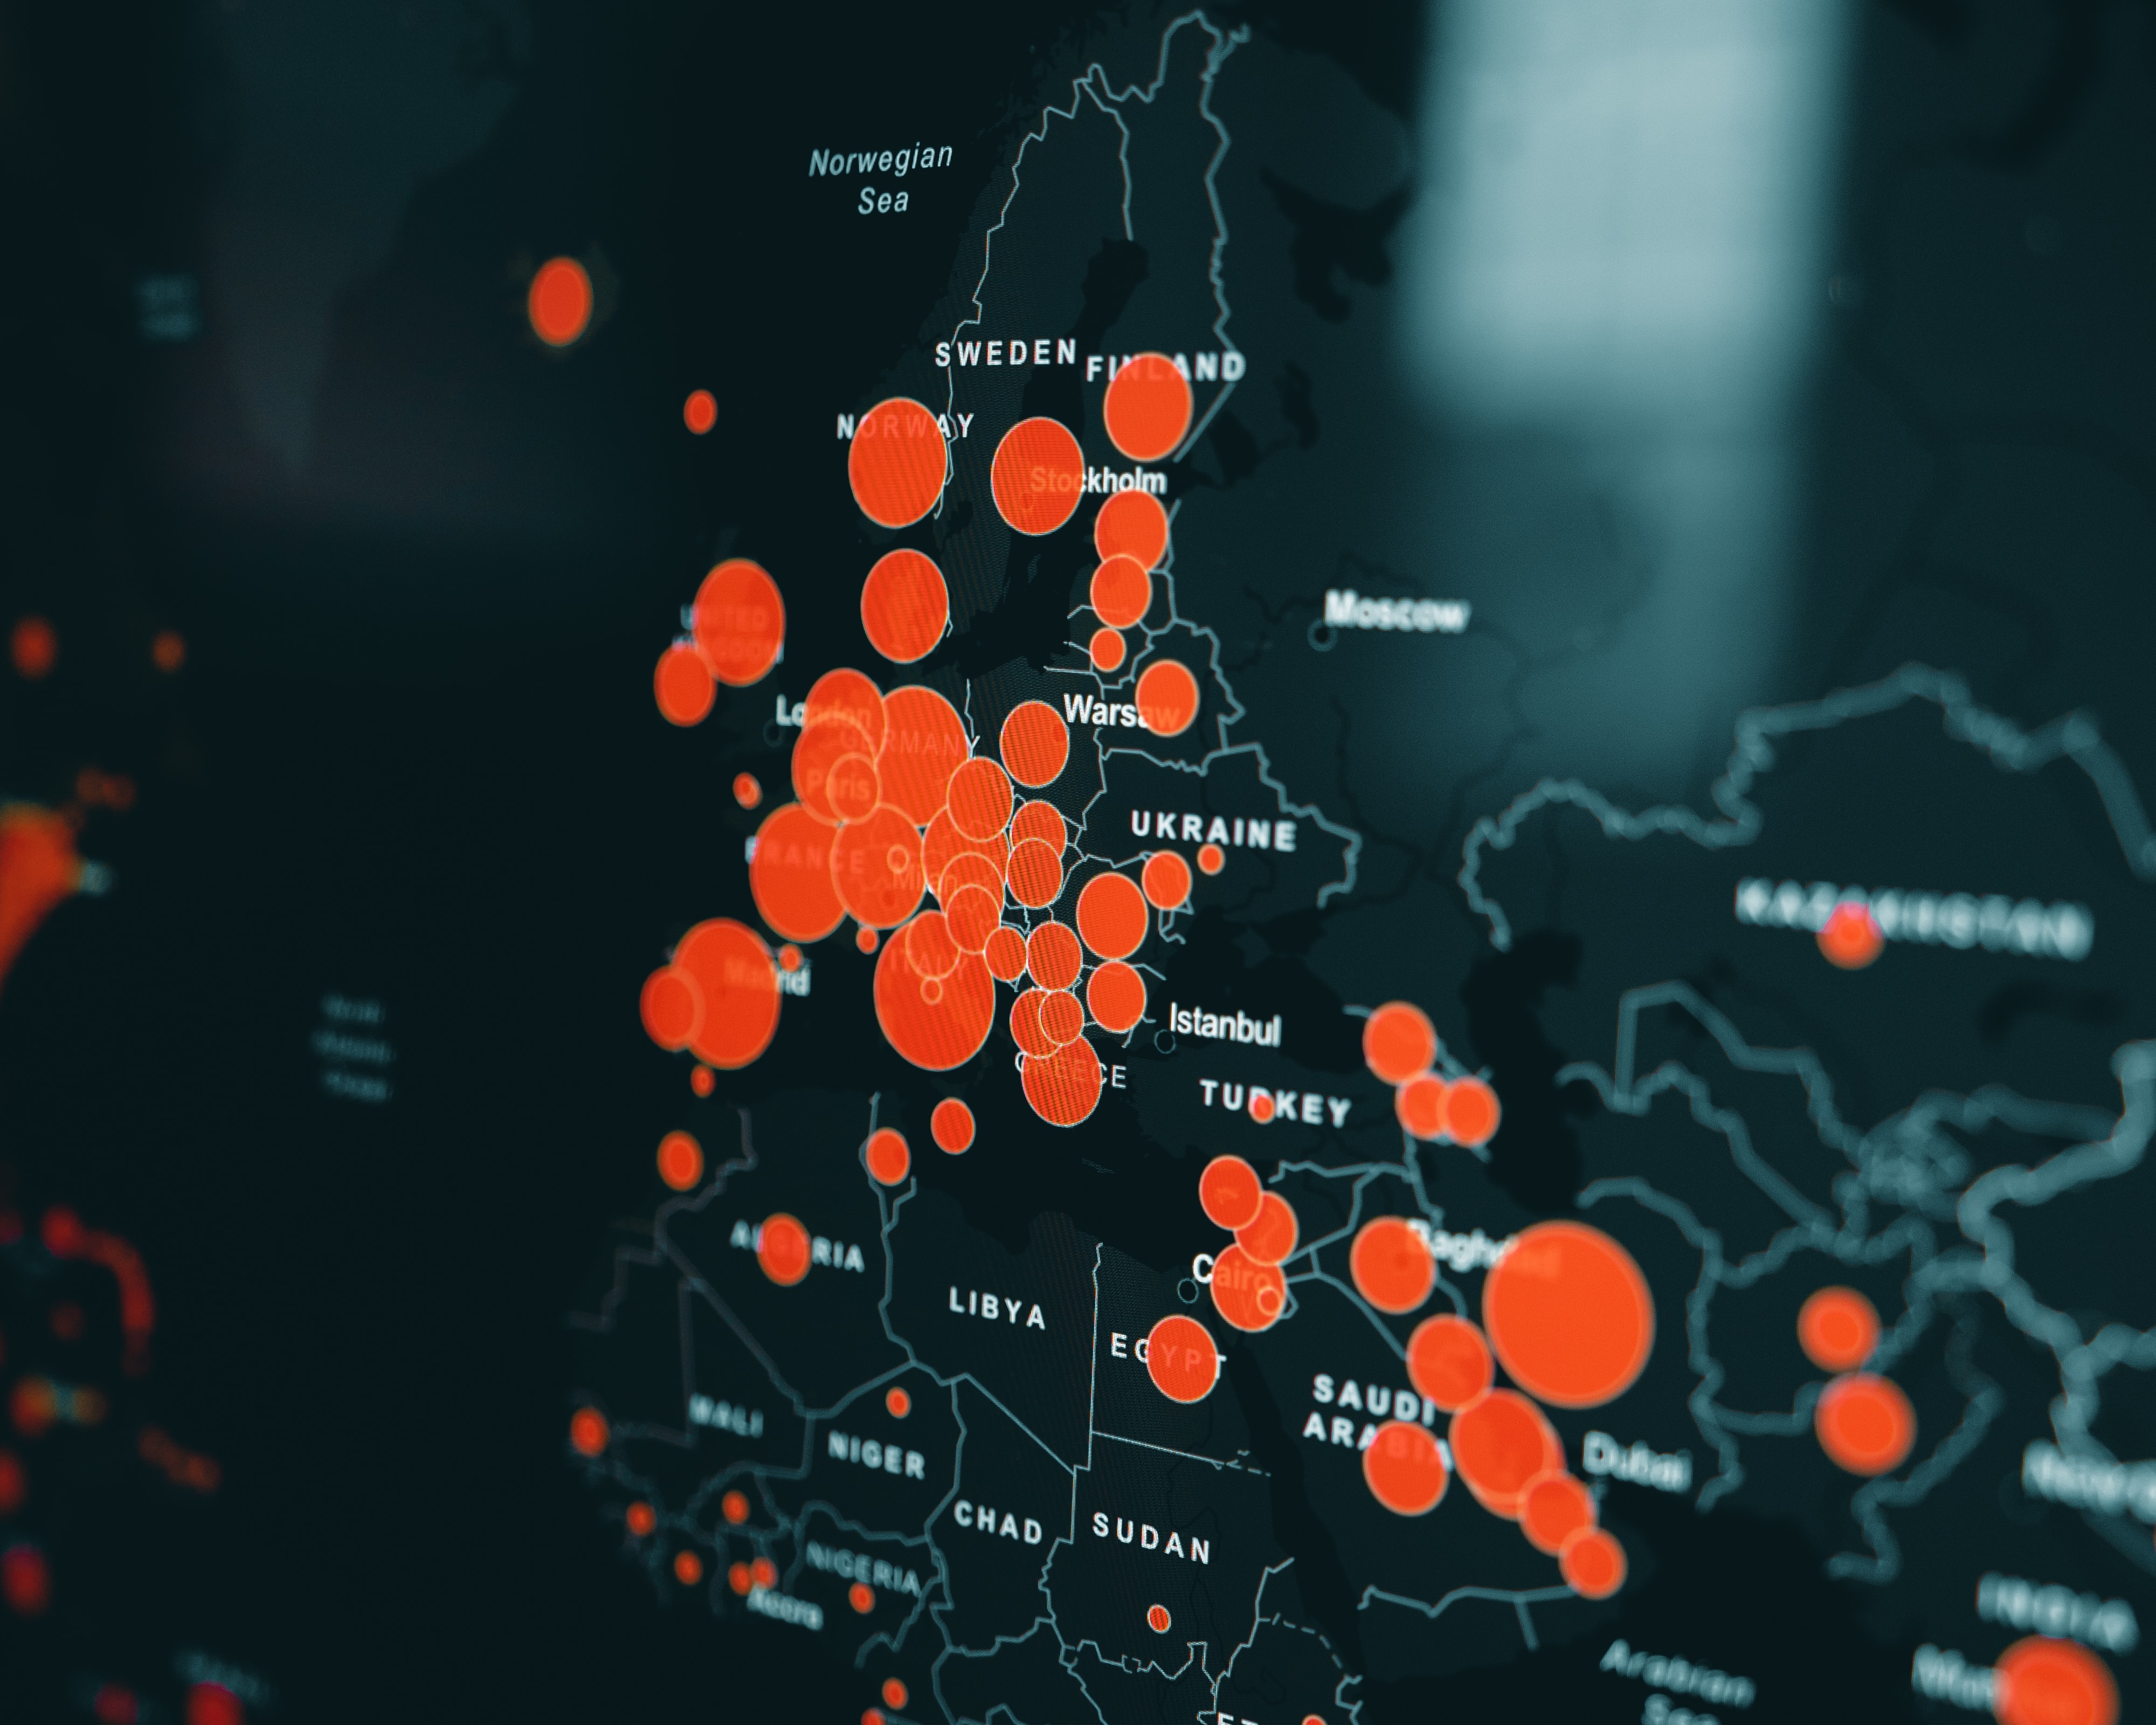
In this article, I explain the different ways data can be used for social good.
Publication: Towards Data Science

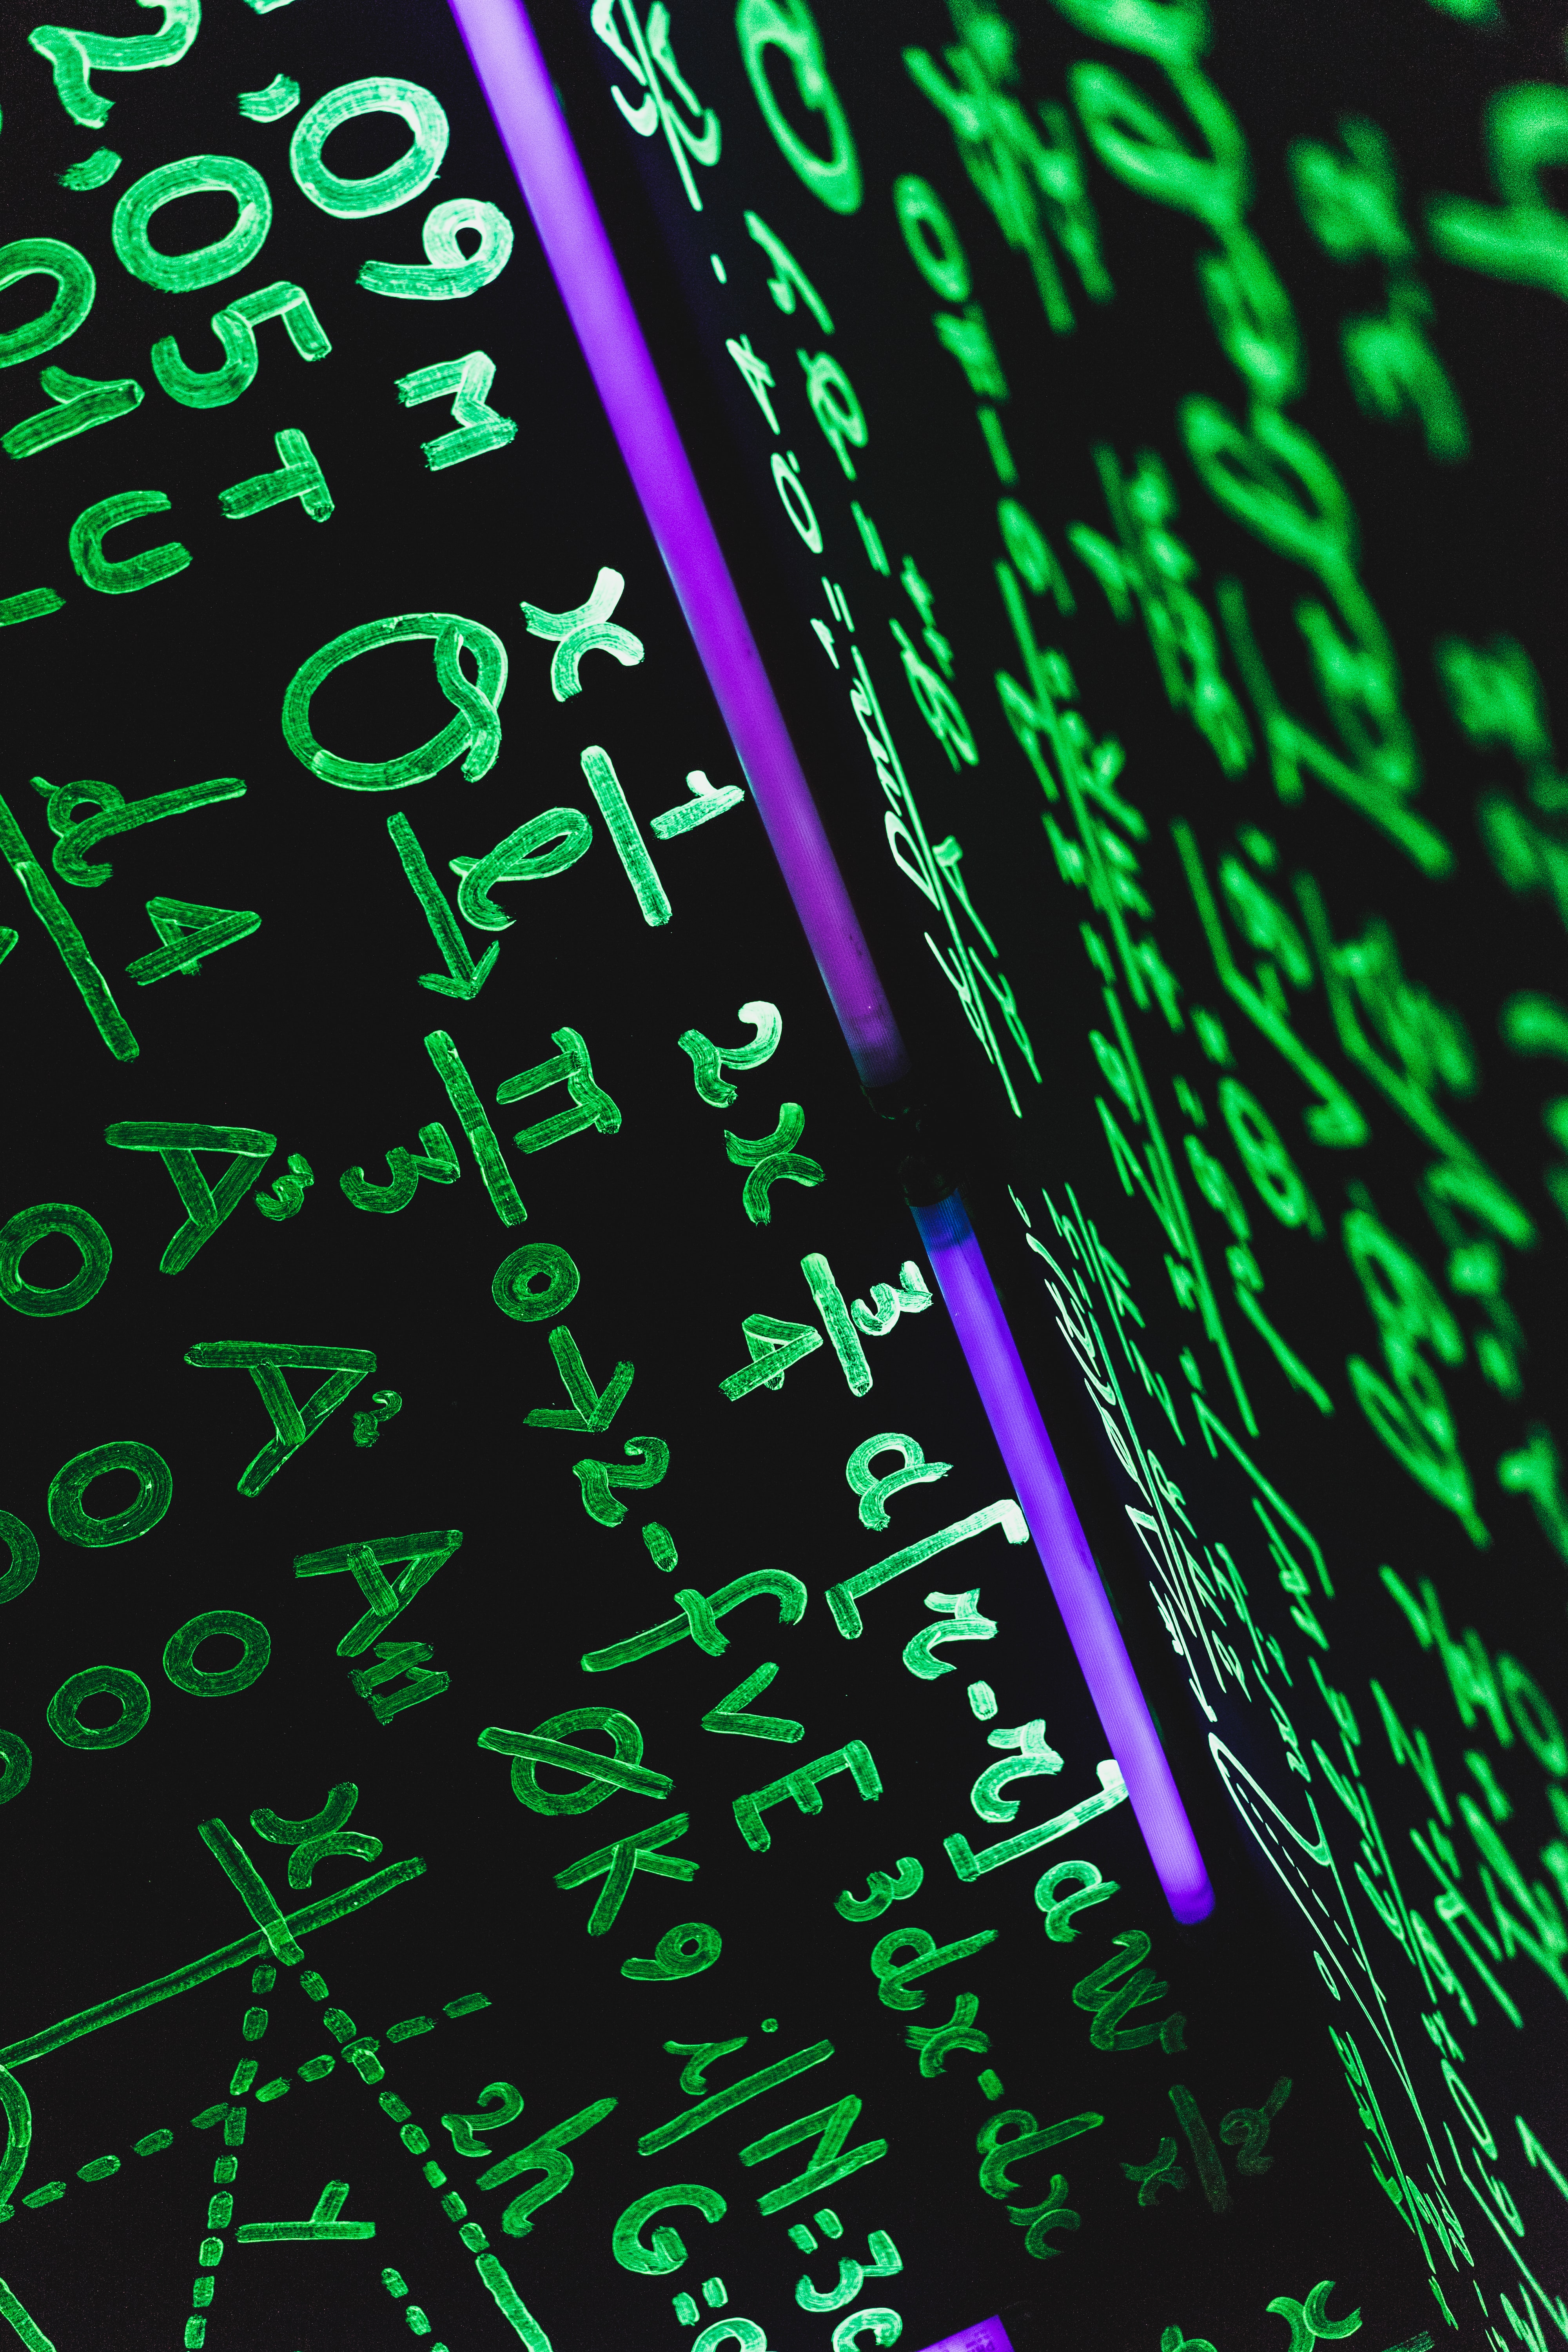
Data can be used to lie. Statistics can be used to exaggerate, blow incidents out of proportion, and push political agendas.
In the world we live in today, the consequences of misusing statistics can be disastrous. Misinformation can spread like
wildfire on the Internet, with claims that they are backed up by scientific proof.
In this article, I explain the different ways statistics can be misused. I provide case
studies on how data has been used to mislead people in the past.
The aim of this article is to inform readers about the dangers
of believing a statistic without doing proper research.
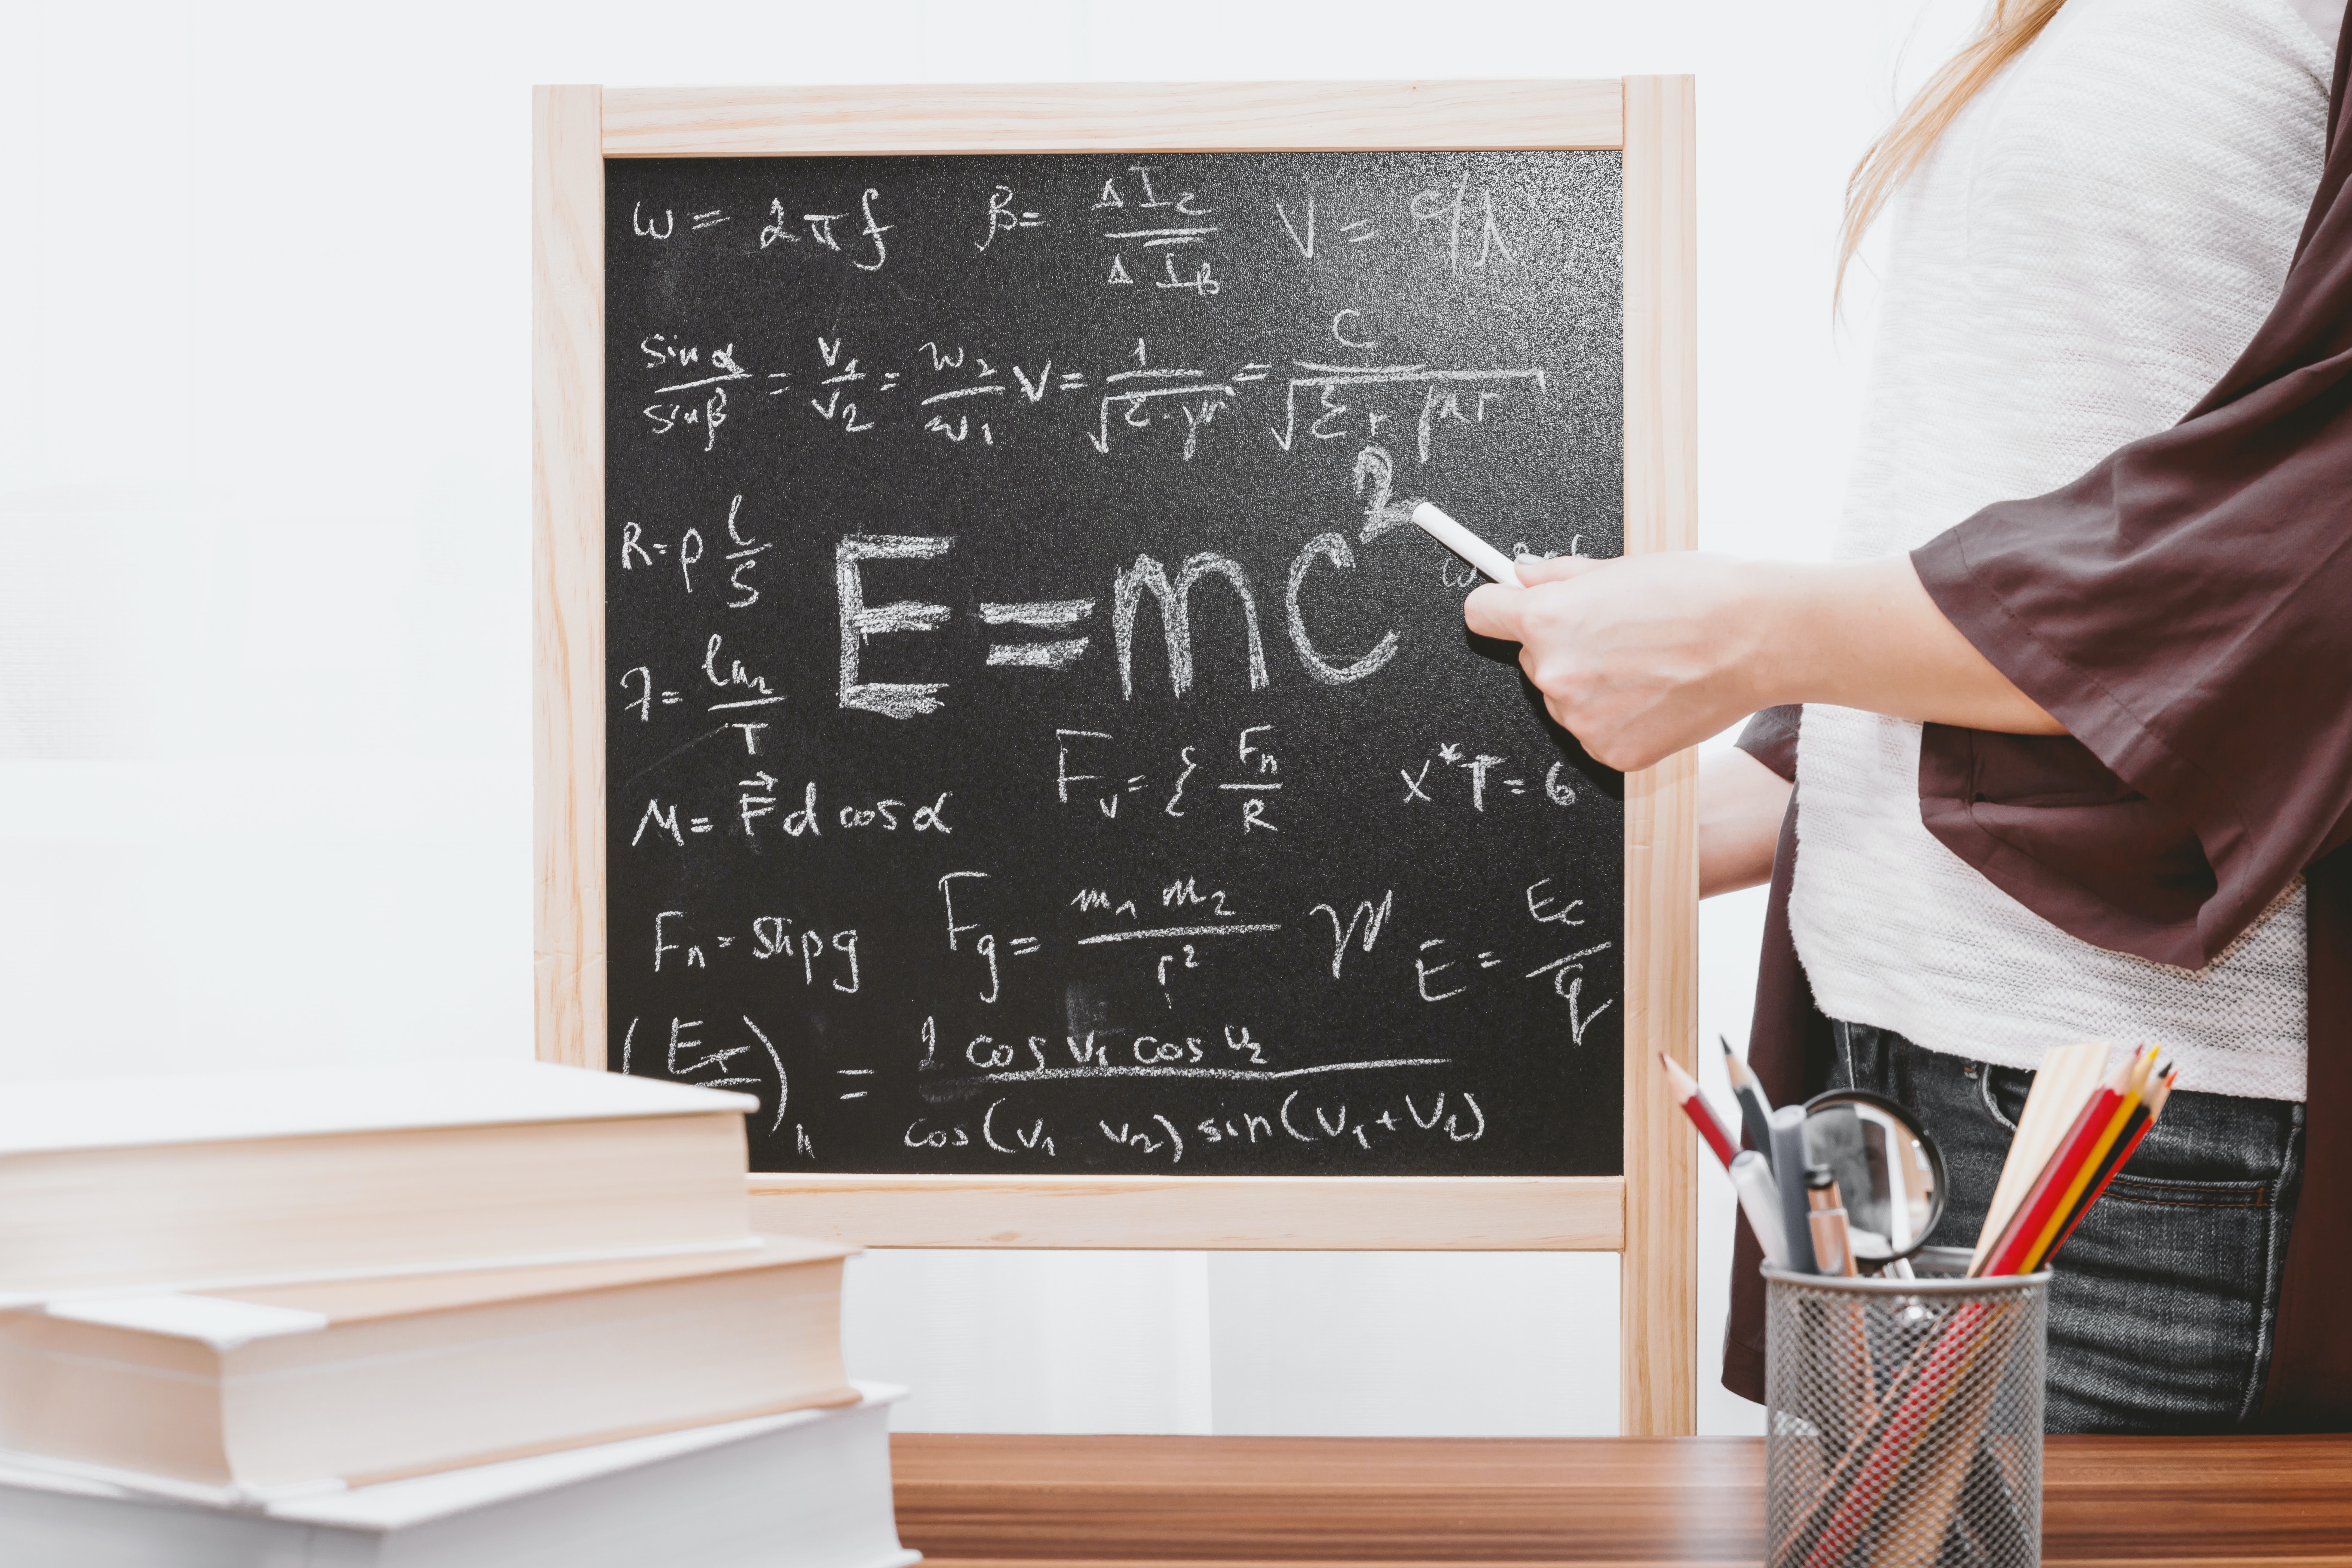
In the first coding class I took in my life, my lecturer told me that “some people just weren’t cut out for programming.”
I believed her and stopped trying to learn how to code.
I thought that there were two types of people in the world – those who were cut out for programming (the geniuses), and those who weren’t.
It was only after spending around 8 hours a day programming for a few months that I realized my lecturer was wrong. I also realized that there were a lot of people just like me, who gave up on learning to code simply because they thought they weren’t cut out for it.
I wrote this article to clear any misconceptions people might have about learning how to code. The best programmers I know aren’t geniuses or straight A students. They possess a set of traits that can be built along the way, which I highlight in this article.